Conservatives open up a 14-point lead over the Liberals as Poilievre’s personal rating turns positive

September 7, 2023, 4:12 pm
David Coletto
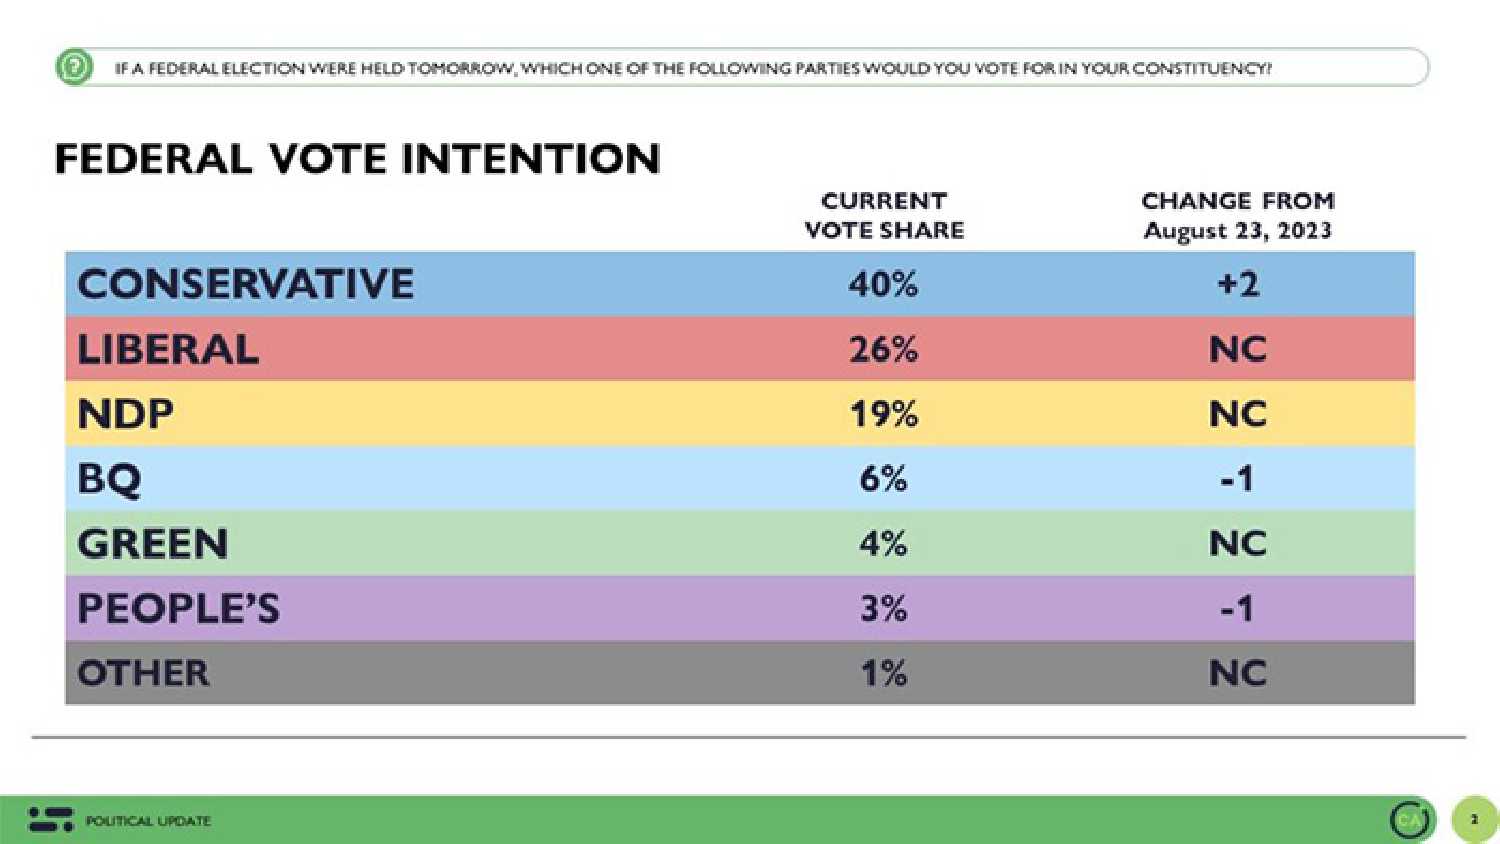

See the above graph for more details.
shadow

From August 29 to September 4, 2023, Abacus Data conducted a national survey of 3,595 adults exploring several topics related to Canadian politics and current events as part of our regular national omnibus surveys. In this survey, we oversample Ontario to a total of 2,010, BC to 700, and Atlantic Canada to 521 (we will be oversampling Atlantic Canada regularly to make sure we get a more accurate read of that region).

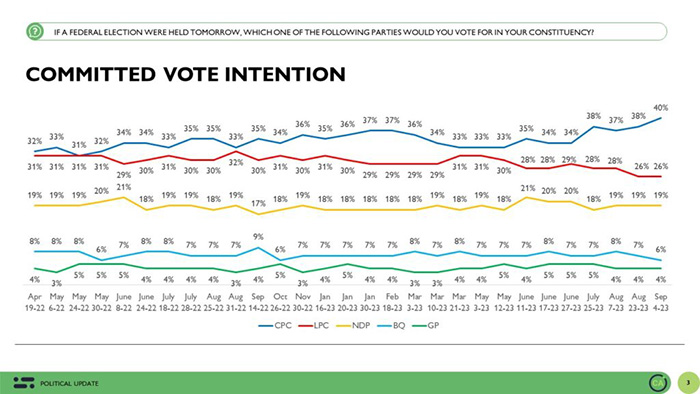
As Conservative activists are set to meet today in Quebec at their national convention, our tracking finds the party has opened up its largest lead over the Liberals since the 2015 election.

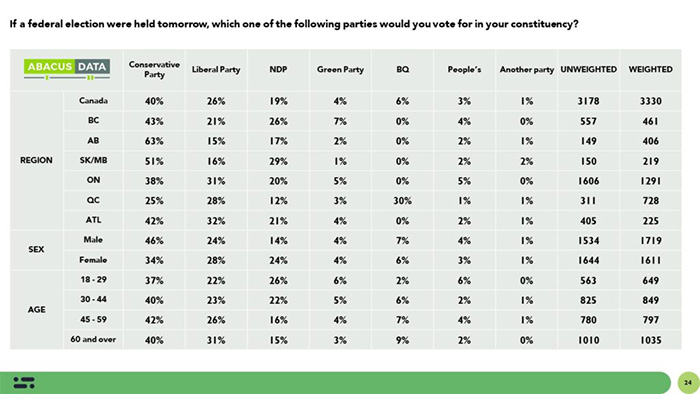
If an election were held today, 40% of committed voters would vote Conservatives with the Liberals at 26%, the NDP at 19% and the Greens at 4%. The BQ is at 30% in Quebec.

Since our last survey a two weeks ago, the Conservatives are up 2 while the Liberal and NDP vote share is unchanged.

“See


shadow

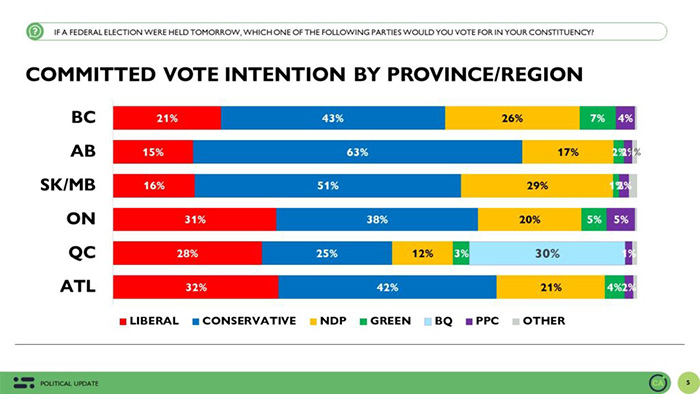
Regionally, the Conservatives lead in every region except for Quebec. They have big leads in Western Canada, a 7-point lead in Ontario, and a 10-point lead in Atlantic Canada. In Quebec, the Liberals (28%) and BQ (30%) are statistically tied, but the Conservatives are not far behind at 25%.

“See


shadow

In Ontario, the Conservatives and Liberals are statistically tied in Toronto while the Conservatives lead in the GTHA, eastern Ontario, and southwestern Ontario. Note, the sample size in northern Ontario is quite small so caution should be used when making any conclusions about ballot support in that region.


See the above graph for more details.


shadow”><br />
<br />
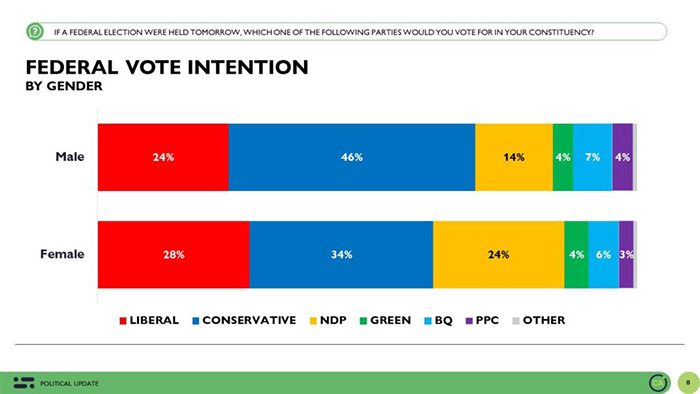
Demographically, the Conservatives lead across all age groups and among men and women. The Conservatives have an 11-point lead among those aged 18 to 29, a 17-point lead among those 30 to 44, and a 16-point lead among those aged 45 to 59. Among those 60+, they lead but by a smaller 9-point margin.<br />
<br />
<div class=
See the above graph for more details.


shadow

Among men, the Conservatives lead by 22-points and lead by 6 among women.


See the above graph for more details.


shadow

What is driving the Conservative lead?
As we have highlighted in the past, this sizeable national Conservative lead is being caused by two factors.

The primary driver, in our view, is the negative impression people have of the Liberal government and Prime Minister Trudeau.

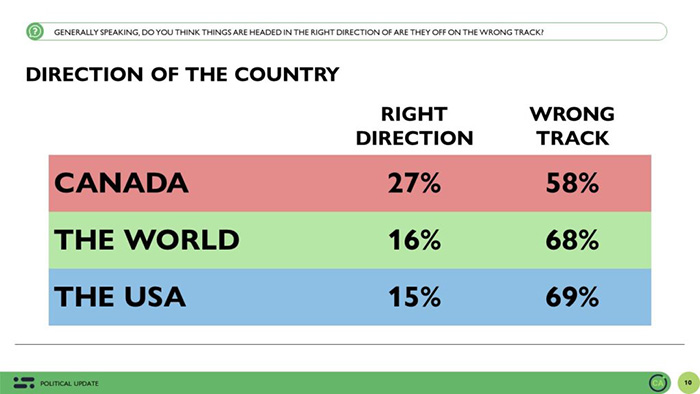
The mood of the country remains decidedly negative. Only 1 in 4 feel the country is headed in the right direction.


See the above graph for more details”></a><br />
<p class=See the above graph for more details


shadow

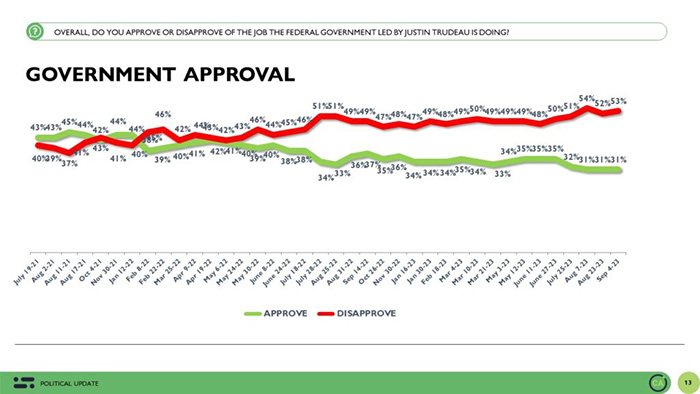
The federal government’s approval rating remains at its weakest since 2015. 1 in 3 approve (31%) while half (53%) disapprove.


See the above graph for more details

shadow

The Prime Minister’s net favourable rating is -24, unchanged from last wave and consistent with polling over the past four months. Note, at the end of the 2021 campaign, Justin Trudeau’s net favourable was -6.


See the above graph for more details

shadow

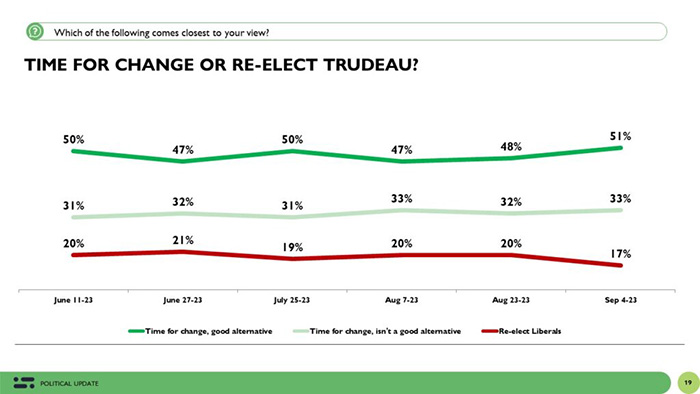
Finally, 83% of Canadians want to see a change in government and only 17% believe the Liberals deserve to be re-elected. Those who say it’s time for a change and feel there is a good alternative to the Liberals is up 3 points since mid-August and is numerically the highest we’ve tracked since June at 51%. 1 in 3 continue to want change but aren’t completely comfortable with the alternatives.


See the above graph for more details

shadow

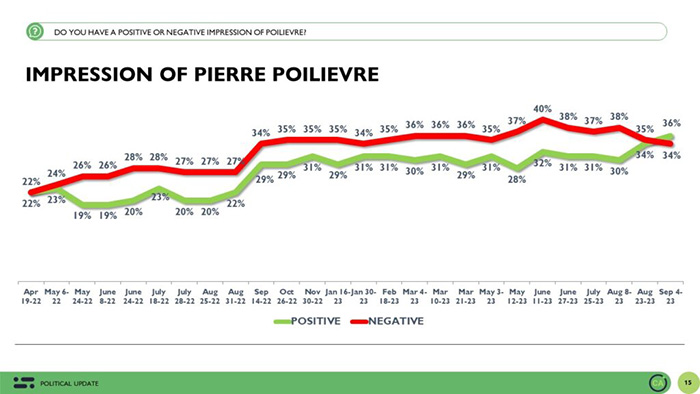
But the growth in Conservative support is not just being driven by dissatisfaction with the Liberals. We also have seen a significant improvement in impressions of Pierre Poilievre over the past month. For the first time in our tracking, more people have a positive view of Poilievre than have a negative one. His net favourable is +2 with 36% having a positive view and 34% having a negative one. Since early August, Poilievre’s negatives are down 4 points while his positives are up 6.


See the above graph for more details

shadow

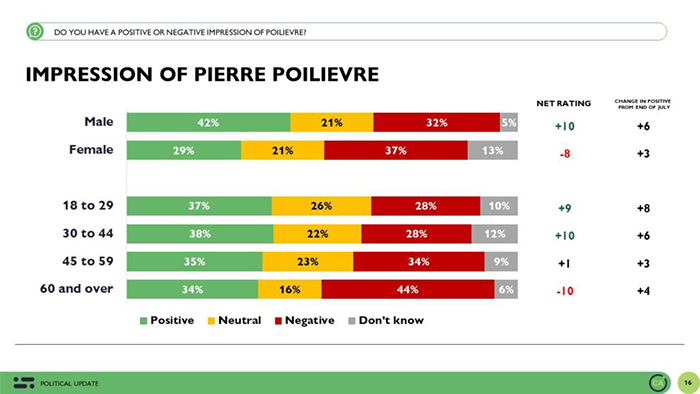
When we look specifically at the demographic breakout, we find he has a net favourable rating among men (+10) and among younger Canadians while his image is negative among women (-8) and older Canadians 60+ (-10). We have seen an improvement in positive impressions for Poilievre across all these groups, with the biggest gains among men (+6) and those aged 18 to 44 (+7).


See the above graph for more details

shadow

It’s also worth noting that the Conservatives have a larger accessible voter pool than the Liberals. Today 51% of Canadians say they are open to voting Conservative compared with 46% for the Liberals and 44% for the NDP. For comparison, the accessible voter pool for the Conservatives at the start of the year (January 2023) was 47%.

Deep dive: Does the Liberal government have a plan?
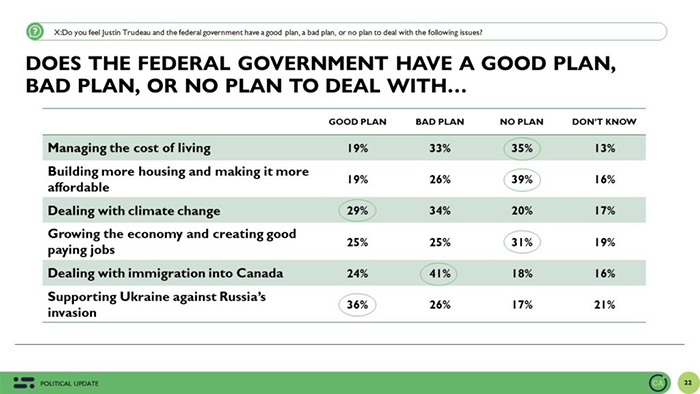
In this survey, we also added a new question asking people if they thought the Liberal government and Justin Trudeau has a good plan, a bad plan, or no plan when it comes to several salient policy areas. The results overall are instructive and suggest most Canadians feel the government has either a bad plan or no plan to deal with most of the top issues facing the country.

For example, on managing the cost of living – by far the top issue for Canadians – only 1 in 5 feel the Liberals have a good plan to deal with the issue. Another 33% say they have a bad plan while 35% think the government has no plan.

Views are the same when it comes to building more housing and making it more affordanle – only 1 in 5 think the government has a good plan. The rest think it has a bad plan (26%) or no plan (39%).
And what about the economy? 25% think it has a good plan, 25% think it has a bad plan while 31% think it has no plan.

The only two areas where there’s some sense the government has a good plan is when it comes to supporting Ukraine against Russia’s invasion (36% good plan, 26% bad plan, and 17% no plan) and climate change (29% good plan, 34% bad plan, 20% no plan).


See the above graph for more details


shadow

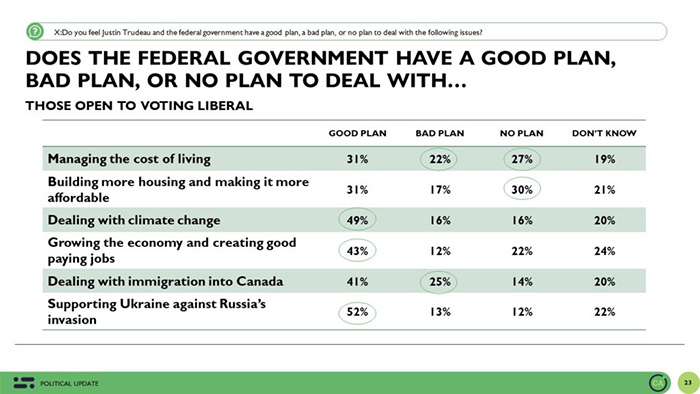
But the results are even more concerning for the Liberals if you focus in on only those open to voting Liberal – the 46% of who say they would consider voting Liberal. Among this key audience for the Liberals, a sizeable proportion feel it has a bad or no plan when it comes to the cost of living (49%), housing (47%), or growing the economy (34%).


See the above graph for more details


shadow

The implication of this is quite clear: the government hasn’t done enough or at the very least hasn’t communicated its plan or vision clearly and effectively enough. About half of those who are open to voting Liberal don’t think it has a good plan to deal with the issues they are worried most about. That’s sums up the problem facing the Liberals today.

The Upshot
According to Abacus Chair & CEO, David Coletto:
“Our latest survey finds the Conservatives continuing to gain ground as the negative assessment of the Liberal government, the Prime Minister, and the state of the country holds. As Conservatives gather in Quebec today, momentum is clearly on their side.

Many Canadians are unhappy with the direction the country is taking and are skeptical of the Liberals’ ability to address key issues. Many don’t think the Liberals even have a plan to deal with the issues they care most about. The Conservatives, on the other hand, are benefiting not only from the Liberals’ decline but also from a rising positive perception of their leader, Pierre Poilievre. In the absence of a sustained counternarrative from his opponents, Poilievre’s introduction to many Canadians is bearing fruit and the Conservative leader finds himself in a stronger position than any of his predecessors at this point in their leadership mandates.

Subscribe to David’s Substack to get deeper insights into what’s happening in Atlantic Canada and British Columbia in the coming weeks along with other data and insights on Canadian politics.

Methodology
The survey was conducted with 3,595 Canadian adults from August 29 to September 4, 2023. A random sample of panelists were invited to complete the survey from a set of partner panels based on the Lucid exchange platform. These partners are typically double opt-in survey panels, blended to manage out potential skews in the data from a single source.

The margin of error for a comparable probability-based random sample of the same size is +/- 1.7%, 19 times out of 20.

The data were weighted according to census data to ensure that the sample matched Canada’s population according to age, gender, educational attainment, and region. Totals may not add up to 100 due to rounding.

This survey was paid for by Abacus Data Inc.

Abacus Data follows the CRIC Public Opinion Research Standards and Disclosure Requirements that can be found here:  https://canadianresearchinsightscouncil.ca/standards/


See the above graph for more details


shadow

About Abacus Data
We are the only research and strategy firm that helps organizations respond to the disruptive risks and opportunities in a world where demographics and technology are changing more quickly than ever.

We are an innovative, fast-growing public opinion and marketing research consultancy. We use the latest technology, sound science, and deep experience to generate top-flight research-based advice to our clients. We offer global research capacity with a strong focus on customer service, attention to detail, and exceptional value.

We were one of the most accurate pollsters conducting research during the 2021 Canadian election following up on our outstanding record in 2019.

shadow

shadow